- Chart coverage
- GRIB data and presentation
- Internet AIS
- Download polar files
- Social Boating
- Weather Forecast
- Weather Routing
DOWNLOAD POLAR FILES If you don’t want to create your own polar file, you can download them. If you miss any boat, please contact us at [email protected]
Download polar files here
A polar diagram describes how fast a sailing boat may go at different wind speeds (TWS) and in different angles to the wind (TWA). Every type of boat has its polar diagram (or VPP, velocity prediction program), computed from hull shape, weight, rigging and a sail setup. Seapilot uses the polar diagram to compute the fastest choice of path at a given forecast for wind (and current). The polar diagram is imported to Seapilot as a polar file in text format (.txt, .csv or .pol). The name of the boat type or the specific boat is suitable to use as a name of the file (for instance J80.txt). Here at our website you can get access to polar diagrams for more than three hundred boat types. More are coming with time. You may also find polar diagrams at manufacturers, vendors, class associations and others. If you miss any boat, please contact us at [email protected]
For more polars, visit jieter.github.io/orc-data/site where you can find polars for almost any boat.

Polar file formats
A polar file contains a table representation of the polar diagram. You can also get data to your polar file for instance from a measurement certificate, from the maker of the boat or from your class association.
If you don’t have the data in tabular form, but as a diagram, you can at every given TWS do readouts at a number of different TWAs (for instance 30, 45, 60, 90, 120, 150 and 180 degrees).
Choose the format (1 or 2, see below) that best corresponds to the format of the data that you have got.
- Create a new file in Excel.
- Replace blue text with your own numbers, let the black text remain.
- TWS should be true wind in knots.
- TWA should be true wind angle in degrees.
- BSP should be optimal boat speed in knots.
- TWS should be ordered from lowest to highest.
- TWA should be ordered from smallest to biggest.
- If needed, add new lines and/or columns.
In particular for format 1: The first line should indicate the wind speeds (TWS) valid for all following lines. Delete lines 2-3 and the two last if data for beat angle/beat VMG and gybe angle/run VMG respectively are missing. Note that beat and run speed should be given as speed in direction of the wind (VMG), not as boat speed (BSP).
Template Format 1 (non editable)
In particular for format 2: There must be the same number of TWA-BSP pairs in every line. Every TWA should be directly followed by the correpsonding BSP (for the TWS valid for that line).
Template Format 2 (non editable)
When you are ready: remove unused columns and lines. Choose File/Save as; choose File format Text (tab delimited) (*.txt). Use your boat type as the name of the file.
Import polar files to your smartphone/tablet
To provide polar data for Seapilot may be simple, and it may be complicated. Choose an alternative in the following order until you find one that is working.
A. If you have a polar file (with file type .txt, .csv or .pol)
- Send the file as an e-mail attachment to yourself.
- Open the e-maíl on your seapilot unit and tap on the attachment. (On iPad/iPhone furthermore: tap the share symbol in the upper right corner and choose Seapilot as the target for the import.)
- Check to see the message ”Import saved OK” meaning that the file format and the data were correct.
- If the import did not succeed you need to reformat the file (see next section).
B. You find your boat type among more than 300 polars on seapilot.com
- Open a web browser on a PC or Mac and go to seapilot.com.
- Choose Features / Polars and Download polar files.
- Click the desired polar/boat type.
- Open an e-mail agent on the same unit.
- Send an e-mail to yourself with the downloaded polar file as an attachment (you find it in Downloads on both PC and Mac).
- Open the e-mail on your iPad/iPhone/Android unit(s) and continue as described i A 2-4.
C. If you have polar data as a table on paper
- Write these data into one of the Excel templates available om seapilot.com and follow the instructions found there.
D. If you have polar data as a table in .pdf format or similar
- Do as in case C; or copy, paste and edit the data using for instance Word or Excel into a format as described in the next section.
- Save as .txt and go on as in case A.
E. If you have polar data only as a diagram
- Use a ruler and do readings in the diagram for a number of TWSs and TWAs.
- Use for instance Excel to do scaling and save in a template as in case C.
F. If you have polar data for a closely resembling boat
- Do as in case A.
- Correct your polar using the parameters Performance upwind and Performance downwind (see the description of the Auto route menu above).
G. None of the above and cannot get data from the designer, the boat builder, a vendor or the class association
- Download iPolar from App store (at a cost of about 12 USD; Seapilot takes no responsibility for this app).
- Choose the Boat tab and give a name to the boat.
- Under Parameters, record boat’s length, displacement and sail areas.
- Check the polar data created by the program under Polars and Values.
- Tap the letter symbol and send data (will be as a .txt file) to your own e-mail address.
- If you want a spinnaker to be included in your sail setup you must use the two files Main+Jib.txt and Main+Spin.txt to create a new .txt which in every position contains the maximum of the corresponding values in the two other files.
- Continue as in case A.
Beware any error messages when you use the polar file for the first time (see section Autoroute in the manual).
- Video Tutorials
- Advantages of Seapilot
- AIS presentation in Seapilot
- App settings and functions
- Chart presentation
- Coastal Forecasts and AIS real-time observations
- GPS and Internet
- Purchase and subscription
- Planned versions
- Press Releases
- Media material
- Mentions in media
- Privacy Policy
Privacy Policy EULA

© 2024 Seapilot AB
- Boat Reviews
- Press Releases

Understanding Polar Diagrams: Sailing by The Number to Maximize Performance

Remember studying for that high school math test and wondering why you had to learn stuff that you would never use again?
Well, surprise! It turns out that math is at the very heart of the sailing experience. Indeed, your Leopard is essentially a massive collection of calculations and equations slicing through the water.
TSW, TWA and VPP
Perhaps the most helpful bit of seafaring math to understand is your Leopard’s polar diagram. A polar diagram shows how fast a sailboat could potentially travel at different wind speeds (TWS=True Wind Speed) and various angles to the wind (TWA=True Wind Angle). Every sailboat model has a unique polar diagram, which displays the results obtained using a velocity prediction program (VPP) based on the craft’s weight, hull shape, rigging and sail setup.
You can find your Leopard’s polar diagram below:
Link to Leopard 42 polar diagram
Link to Leopard 45 polar diagram
Link to Leopard 50 polar diagram
The calculations represented in your boat’s polar diagram are a powerful tool for charting a course, estimating passage times, and choosing your sail plan for maximum efficiency.
Choosing the right sail
"The polar is an excellent way to answer the question, should I still be sailing with a jib, or should I switch to a spinnaker or a reacher,” says yacht designer and naval architect Alexander Simonis. “Everybody knows that when you sail downwind, the jib is not that efficient. You go to a spinnaker, an asymmetric spinnaker, a gennaker, as a downwind sail. But when you want to know something more specific, such as, what sail is best on a reach in 25 knots of wind? Or should I switch now to another sail? That’s where the polar can help.”
Following the polar diagram correctly
While a polar diagram can look daunting at first glance, it’s actually pretty simple to follow.
A polar consists of three data indicators — straight lines, circles and curves. The straight lines that radiate out from the center represent the True Wind Angle (TWA). The circles, which also spread from the center, represent boat speed through the water (STW).
The colored curves, overlaid on the grid created by the straight lines and circles, plot the boat’s predicted speed at various combinations of TWS and TWA. The colors represent different sail plans.
The diagrams are usually divided into upwind and downwind sections.
.jpg?width=1286&name=Leopard%2045%20(1).jpg "sailboat polar diagrams")
To read the Leopard 45 polar diagram shown here, start by looking at one of the colored curves — say the blue line, which tracks the mainsail and jib sail plan. As you trace that curve through different TWAs, you can see the predicted boat speed with that sail configuration. At 50 degrees TWA, for example, your Leopard 45 should be making 10 knots. At 120 degrees, the boat should travel at 12 knots.
If you’re not making those speeds, your sails may need to be trimmed.
Keep the data close
The velocity prediction data displayed on a polar diagram can also be presented in table form. One way to get maximum use from data is to laminate a copy of your VPP table and post it near the helm for quick and easy reference.
According to Simonis, the popularity of using polar diagrams has only recently increased with recreational sailors. Why? Maybe it’s another example of how we’ve come to embrace the power of data in our lives.
Or maybe math teachers are just doing a better job of selling their subject.
Topics: FAQ

Leopard Catamarans
Subscribe here.
- Yachting World
- Digital Edition

5 tips on developing your polar diagrams to improve your boat speed
- May 25, 2016
To help minimise your losses you need to sail your boat to its target boat speeds. Jonty Sherwill asked designer Mark Mills for his tips on polar diagrams
© ROLEX/Daniel Forster
Sails are fresh, the bottom is clean, there’s a good crew, but you’ve been losing out to similar boats on the downwind legs. The helmsman is sailing as close as possible to the target speeds displayed so why is it not doing the trick?
But who sets these target boat speeds and why do you sometimes fail to match them and at other times do so much better? Most of us are familiar with polar diagrams showing a boat’s potential speed on each point of sailing, but how do you put this information to good use?
For those who sail dayboats or small cruiser-racers without a log or wind instruments, judging speed and sailing angles is largely intuitive, as you observe the progress of other boats around you. An electronic compass and depth sounder may be as high-tech as it gets.
Although this ‘seat-of-the-pants’ ability remains an essential part of sailing larger yachts, the information made available by more advanced electronics provides a far better understanding of how the conditions are affecting performance.
Even if the boat has top-of-the-range instruments and came with a set of polars from the designer or an ORC rating certificate this will be just a starting point. Some budget electronics packages won’t provide target boat speeds from within the software, but this doesn’t prevent you developing your own data.
Either way it seems there’s no quick fix and if someone’s bragging how they always sail faster than their targets, good sailing may be part of it, but it’s just as likely to be that the instruments need calibrating and time should be spent developing the polars.
2. Calibration is king
There is no point in having targets if your boat speed is inaccurate. Good instrument calibration is vital, a daily task on top-level raceboats where crew are looking to get within +/– two per cent accuracy.
It’s unlikely many club level racers get consistently close to this target without regular calibration checks, yet what would people say to a designer claiming targets not even accurate to +/–2%?
The calculations that even the most basic system carries out rely on inputs from the log, compass and masthead wind sensor so the calibrations for each should be checked at least at the start of each season and probably more often.
2. Don’t believe the VPPs
Basic parametric VPPs (velocity prediction programs) often used to generate target boat speeds or ORC handicaps are not particularly accurate when compared with programs used for grand-prix boats using CFD (computational fluid dynamics) to simulate the flow of water around the hull. They may be under-predicting, so don’t be satisfied just because you are ‘sailing to targets’.
Also be very sceptical of comparing new models based solely on targets; you have no guarantee that they reflect the actual boat being considered.
3. Theory to reality
Even if very high-quality, a set of polars can only reflect the computer model they started with, and express it in a set of targets unique to that boat. A different displacement, sailplan, alloy or carbon rig, shallow or deep keel type, or crew weight, will lead to more or less different results.
If the targets weren’t created for your boat and configuration don’t expect too much from them, though they may be a good starting point. Output varies from program to program, and remember they aren’t set in stone, so amend your targets.
4. Good sailing
Even the best polars and instruments cannot substitute for natural sailing ability and, by getting to know your boat, you can build an invaluable guide for the helmsman and trimmers just from your own data.

Having good targets on a laminated sheet in the cockpit can put you in better shape than many more expensively equipped boats. However, eyes out on the racecourse and the competition is often more valuable than eyes down on the instruments.
5. Build your own polar diagram
Either start with targets for something similar or note your own performance expectations based on experience (eg, ‘7.2 upwind in 18kn is about right’) and then start paying attention and updating those numbers as you learn what works better – that’s what the pros are doing.
To establish a basic set of polars for your boat there are tablet apps (eg, iPolar) that can provide a starting point and, by noting actual performance from the log (boat speed, not GPS), a pretty accurate set of targets can be developed during the season for a range of wind conditions and sea state.
Mark Mills is a designer well known for winning designs such as Mariners Cove, Tiamat, Alegre, and production designs such as the King 40 and DK 46. Originally from California, Mills studied yacht design at the Southampton Institute, before launching his first design, Aztec, in 1996. Now based in Ireland, he was named 2009 Irish Sailor of the Year for ‘exceptional achievements’.
How to read a polar plot for sailboats
Read the article How do Polar Plots Work for updated and additional explanations.
The polar plot is the navigator’s friend. Below is an example for one particular boat for one particular true wind speed. They are published by each manufacturer for each model of boat with their various sail plans. It shows the theoretical attainable speed for a specific sailboat at various wind speeds.
It’s easy to read – move your finger radially along any true wind angle. Stop when you reach the boat performance line associated with the true wind speed you are experiencing. Now, read back around the concentric boat speed circles to the vertical axis and read off the polar boat speed for that given true wind angle and that given true wind speed. This is the speed at which your boat should be sailing and is the polar boat speed to give your sail trimmers to try to achieve.
Observe the example animation of a polar plot for an example sailboat for true wind at 12 knots. Click on any TWA (true wind angle) on the right bar and watch:
a. the boat icon move to that position on the polar plot. Then read around the polar plot to find the boat speed b. the wind meter boat speed and TWA. They should match the polar plot if the sail trimmers are doing their job properly.
On a real polar plot, you would see other true wind speeds shown on the plot. Left off here so as not to clutter the image.
NauticEd sailing courses are jammed with information like this to make you a better sailor and give you a recognized sailing certification by yacht charter companies worldwide.
Start by taking the NauticEd Day Skipper Course or if your looking for Coastal Navigation information, take our NauticEd Coastal Navigation Sailing Course .
- Recent Posts

- RYA Day Skipper with NauticEd - April 1, 2024
- NauticEd uses the SailTies GPS Tracking App - March 29, 2024
- Sea of Cortez Flotilla – February 2025 - March 8, 2024
You might also like

TWEET ABOUT

FIGHT CHILDHOOD CANCER
NauticEd is a fully recognized education and certification platform for sailing students combining online and on-the-water real instruction ( and now VR ). NauticEd offers +24 online courses , a free sailor's toolkit that includes 2 free courses, and six ranks of certification – all integrated into NauticEd’s proprietary platform. The USCG and NASBLA recognize NauticEd as having met the established American National Standards. Learn more at www.nauticed.org .

The NauticEd Vacations team are Expert Global Yacht Charter Agents – when you book a sailing vacation or bareboat charter through NauticEd, we don’t charge you a fee – we often save you money since we can compare prices from all yacht charter companies. PLUS, we can give you advice on which destination or charter company will suit your needs best. Inquire about a Sailing Vacation or Charter .
Online Sailing Courses Sailing Vacations | Charters Practical Sailing Courses Sailing Certification | License
Sign up for 2 FREE Sailing Courses Try sailing in Virtual Reality! Gift a Friend a Sailing Course Sailing Events | Opportunities
About NauticEd Contact Us NauticEd Support Privacy Policy
Home Competition Offshore ORC
Offshore Racing Congress (ORC)
What's new for 2024?
Continual research carried out by the ORC Technical Committee has updated the VPP for 2024. These and other changes approved by the ORC Congress and its Committees are summarized in a Changes to the Rules document available at this link .
It's important to remember that while there are changes to ratings in the new year’s certificate, for the vast majority of boats these changes relative to their competitors are usually <0.5% different in their general handicap.
Updated 2024 Application System
US Sailing’s Offshore Office has spent the off-season developing an improved and more efficient application system, as well as an internal processing system designed to make issuing certificates more accurate, efficient, and repeatable.
US Sailing has assigned a unique boat ID (SKU) to every boat that was received an ORC or ORR certificate in 2022 or 2023. Owners should have received an email from US Sailing assigning a boat ID to their boat. If a boat has not been assigned a Boat ID, they can start their ORC Certificate process below with the New Boat Application form.
US Sailing is in the process of developing a universal measurement database for all offshore sailboats in the US. Assigning each boat a unique ID allows our office to track the boat through its life span in an efficient manner, allowing the office to provide more accurate and timely service to its members.
START YOUR 2024 ORC APPLICATION
Who Owns It
Why did it start.
The ORC was founded in 1969 by the Royal Ocean Racing Club (RORC) and the Cruising Club of America (CCA) to develop a handicap standard for the international community. Since then, the ORC has supported several rules including the IOR, IMS, and, most recently, the ORC Rule. The ORC Rule was structured in the late 2000’s to promote safe design practices and to fairly rate a broad range of designs, including cruiser/racer and modern race boats. The ORC Rule is recognized by World Sailing as an International Rating System. Learn more about the history of the ORC.
How It Works
The ORC Rule relies on a Velocity Prediction Program (VPP) based on standard measurements defined by the Universal Measurement System (UMS). More information on measurement may be found on our Services page. The rating calculator outputs a multi-number rating, suitable for various scoring options and course configurations. While ORC Club and ORC International certificates differ with respect to measurement criteria, they rely on the same calculation routine. As a result, Club and International certificates may be scored consistently with each other. The ORC VPP is updated annually and all rules , regulations , certificates and VPP documentation are freely available to the racing community. ORC scoring options include Time-on-Distance, Time-on-Time , Triple Number, and Performance Curve Scoring. Since 2022 all ORC certificates include custom scoring options tailored to specific races and events are explained on the Scoring Options document.
Who Uses It
ORC is globally recognized in local, national, and international races, making it the most popular measurement-based rating system in the world. With primary interests among European race circuits, the annual ORC World Championships draw international attention to the rating system. The ORC has been recently featured in numerous regions throughout the US, including Galveston Bay racing in Texas; SORC and Key West racing in South Florida; at Charleston Race Week; the Chicago Mac and Bayview Mac races as well as local races in the Chesapeake Bay, Biscayne Bay, St Petersburg, Long Island Sound, Seattle, San Francisco, and San Diego.
Where We Fit In
US Sailing Offshore is responsible for acquiring, processing, and archiving all data to issue ORC Club and ORC International certificates to boats based in the United States.
ORC International
ORCi is based on a complete boat measurement carried out by a US Sailing Official Yacht Measurer as defined by the Universal Measurement System. The hull and appendages must be measured and the offset file approved by ORC to meet ORCi standards. This is the most accurate rating the rule system offers. These certificates are intended for use in World, Continental, Regional, and National level races. To request official measurement, please contact the US Sailing Offshore Office at [email protected] .
- Sample certificate and explanation
Club certificates do not require verified measurement. Instead, owners are allowed to declare select measurements while other parameters are assigned by the rating office. Where input data is lacking, the rating office will apply estimates or default values that err to a faster rating. The more data submitted based on measurements, the more accurate the rating. ORC Club certificates are intended for club-level racing.
- Sample certificate and explanation . *
*Note that the example ORC Club certificate on the ORC website is typically only two pages - US Sailing-issued ORC Club certificates are 4 pages and include all the same information that appears on Pages 3 and 4 of ORC International certificates. Page 2 of both certificate types issued in the US contain scoring options requested by races and regattas held in the US and Canada.
ORC Double Handed and ORC Non-Spinnaker Certificates
ORC policy permits that any yacht with an ORCi or ORC Club certificate is entitled to an ORC Double Handed and/or ORC Non-Spinnaker certificate that is valid as well. DH certificates are designed to model the performance of a boat racing with a shorthanded crew of a default crew weight of 170 kg. Non-spinnaker certificates may not have any Spinnakers or Headsails set Flying active in their sail inventory.
There is a fee associated with these certificates, please see the pricing chart below for more information.
ORC One Design
For specific classes , ORCi and ORC Club certificates are available in a standardized configuration. All data affecting a boat’s rating are standardized based on One Design class rules or past measurements taken reflecting close tolerances. For boats sailing in One-Design configuration, no measurements are needed for these certificates, provided that there is proof supplied to the rating office that the boat is complying with its Class measurements. Any configuration change shall invalidate the ORC One Design certificate and a new standard ORC International or ORC Club certificate must be issued.
ORC Super Yacht
Handicapping widely disparate Super yachts represents one of the most formidable challenges any rule authority can undertake. A Super yacht fleet typically includes schooners, sloops and ketches of varying lengths and with displacements ranging from 50 to 600 tons and the huge disparity in yacht type, size and shape is exceptionally difficult to handicap.
For more: ORC Super yacht
ORC Multihull
Using the same VPP technology as used for rating Monohulls, the ORC team has spent the past 4 years developing an analogous system for a scientific and fair rating system for Multihulls. ORC Multihull certificates are managed and issued by the ORC Central Rating Office.
For more information: ORC Multihull
For boats holding a current year valid certificate, any changes to the configuration must be reported and a new certificate reflecting those changes issued. For ORCi certificates, relevant parameters may need to be remeasured.
Copy Certificates
ORC provides free access to all measurements and any valid certificate issued by any rating office in the world since 2009 through the free ORC Sailor Services database. Measurements and copies of certificates are in HTML format and are available at no charge without limit. Copy certificates are NOT valid for racing.
Alphabetical lists of all boats with current valid certificates are also available on the ORC Active Certificates Database link from the ORC Active Certificates .
To understand how a potential modification would impact a boat’s rating, trials may be ordered through the Sailor Services system on the ORC website. There is no limit to the number of trial certificates issued in the ORC Sailor Services system. For instructions on how to use ORC Sailor Services, instructions are available .
To run trials that include a modification not available in Sailor Services, such as water ballast modifications, the Offshore Office can run trials for the boat. These trials are NOT valid for racing, and have an associated fee, seen here. If you have further questions regarding Sailor Services or running trials please contact the Offshore Office at [email protected] or call 401-342-7953.
TRIAL APPLICATION
Hydrostatics/Stability Data Sheet
Understanding the limitations of stability is important to every boat owner, but this information is also useful to offshore race organizers interested in defining relevant safety standards in their entry requirements. A Hydrostatics/Stability Data Sheet can be produced for a cost of $100.
For more: ORC Stability Datasheet Explanation
Speed Guide
The ORC Speed Guide uses the ORC VPP to develop polar diagrams for your yacht. These diagrams are an asset to understanding relationships between performance, sail selection, wind speed, and wind angle. They display the polar data in graphic, tabular, and digital formats, including the format used by the Expedition routing program.
Pricing at $35 is at a 50% discount from the self-service rate when ordered through ORC Sailor Services.
For more: ORC Speed Guide Explanation , ORC Speed Guide Sample
ORC Pricing
2024 orc – uss pricing (price per foot).
*ORC test certificates of existing boats that have been issued an ORC certificate at any time since 2009 can also be obtained using the online ORC Sailor Services system: Past ORC Certificates
2024 ORC – USS Certificate Add-ons Pricing
While racing dissimilar boats against each other, the ORC system provides handicap ratings based on measurements of the boat, sails, mast, hull, keel and rudder, etc. Using the ORC VPP (Velocity Prediction Program), this data is used to calculate the theoretical speed of the boat in given wind conditions, and this is used to calculate the handicap ratings that will be used by race organizers to score the race.
To apply for the most basic level ORC Club certificate, there is only the most basic information needed: boat type, size (eg, length, beam and draft), keel type, rig dimensions (if known), and crew weight. Sources of this data may be from builder specifications, class rules, etc., as well as from a measurer. Sail dimension data, however, is required to be from a measurer or sailmaker to ensure accuracy, and this includes dimensions for the Mainsail, largest Headsail and largest Spinnaker, in addition to any Flying Headsails (those not attached to the headstay and <75% in midgirth/foot length ratio) and Code 0 spinnakers (75-85% midgirth ratio).
Sailmakers and measurers have now a new online process to enter sail measurement data.
For ORCi certificates, all data must be sourced from a certified measurer, and will include verification of an approved offset file of the boat used to describe the hull and its appendages, measurements of the rig, the freeboards and an inclination of the boat to determine stability.
If you’re interested in measurement, contact Chief Measurer Chris Tutmark ( [email protected] ) for the contact information of a measurer near you.
If your boat is among the ORC One Design class boats found here , and it is in one design class trim, you may apply for an ORC One Design certificate with US Sailing.
Because it is not an approved One Design class by World Sailing, which requires strict compliance to published class rules and meets uniformity standards in design and construction. Without meeting these standards ORC cannot be assured all boats of this type have the same dimensions within reasonable and measurable tolerances and therefore perform to the same ratings. In some circumstances US Sailing will work with class authorities to determine a baseline set of dimensions to use for unmeasured ORC Club certificates.
It’s better to have an ORCi certificate because it gives your boat the most accurate rating, whereas most Club certificates may have un-measured assumed data that may not be accurate: the policy of ORC rating offices is to use data that is least favorable to the rating when there is doubt. Regardless, ratings from either certificate type are compatible for ORC scoring. Note that some races and regattas may require some faster entries to require ORCi certificates (for example, the Chicago-Mac race for boats faster than 515 GPH and in the Long Island Sound and Newport area for boats faster than 560 GPH).
The US Sailing application is located lower on this page under the Application section. Please read through application instructions listed below prior to applying. Also, remember to specify what race you need the certificate and its dates.
Yes, this is necessary because the ORC VPP improves every year to give more fair and accurate ratings, and thus ratings generated from one year’s VPP cannot be used to race against ratings generated from another year’s VPP.
Because the VPP has been upgraded and the new ratings represent the latest in VPP science from research conducted by the ORC International Technical Committee (ITC). Regardless of individual boat rating changes, it is ORC policy to try to keep these changes within about 0.5% for the over 1200 design types in the over 2500 boats rated in the ORCi database. And when comparing ratings always remember to use a competitor’s boat with the same year rating to gauge if there has been any change with the new year.
Because in order to take full advantage of the VPP to accurately model boat performance for a wide variety of boat types to get accurate and fair ratings, the predicted wind conditions during the race are needed to generate these ratings. In the US race managers also prefer to have pre-selected course models to choose from their options so that scratch sheets and scoring can be easily handled by web-based scoring software. Ratings shown on ORC certificates allows this scoring software to easily retrieve this data for use in scoring by simply entering a certificate reference number.
Yes, through use of the online web portal called ORC Sailor Services. With a free registration at Sailor Services , the user can access >150K measurement records including all ORC certificates issued since 2009. With the online search tool several features made accessible: certificate copies, their measurement data, use of an online editing tool to run what-if scenarios to examine rating effects in test certificates, populating online scratch sheets for time allowance tables, and obtaining polar performance data in graphic, tabular and digital formats in an ORC Speed Guide.
For advanced users even the ORC VPP is also available for purchase and download at ORC Software Downloads .
By use of a Time Allowance table that calculates time owed among the class entries for time (for Time-on-Time ratings) or distance (for Time-on-Distance ratings) sailed on the race course. This can be generated online by using the Scratch Sheet tool found at Sailor Services , either by yourself or as provided by the Race Committee.
Yes: all Headsails set Flying (HSF’s, also sometimes called LRH’s) in a boat’s active sail inventory must be measured as Headsails and declared on their certificate. These are sails that are not attached to the headstay. Sails that are larger than 75% mid-girth to foot length ratio are Spinnakers, and they are often called Code 0’s if they are between 75-85%. These sails must be measured as Spinnakers and all must be declared if they are in a boat’s inventory while racing.
Some Cruising classes limit the use of these sails, so make sure to check with your local authority on their rules and guidelines.
Any yacht may get a Roller Furler credit if they race with only one Headsail throughout the range of racing conditions and do not change sails. Some local authorities may amend this by allowing a heavy weather jib in the inventory of Cruising class entries.
The IMS rules give a description of what characteristics of the boat are needed to comply with the Cruiser/Racer designation, which for some yachts confers a small rating credit. The list of this criteria is in an appendix of the IMS rules and can be found here .
Crew Weight is one because it affects a boat’s predicted upwind performance. The greater the crew weight the faster the rated upwind speed because the VPP places that crew where it will have the most advantageous affect on performance – i.e, on the rail in breezy conditions, and to leeward in light air. There is a default crew weight that is used when no declared crew weight is made. Double Handed certificates use a default crew weight of 170 kg, but this can be changed to a declared value.
Once a valid certificate is issued by US Sailing, it remains in force until an amendment may be made to change the configuration of the boat. If this is desired, contact US Sailing with that change and an amended certificate will be issued that will supercede the validity of the previous certificate.
An exception is made when a boat may also want to have a valid Double Handed and/or Non-Spinnaker certificate: these may have their own configuration values for their own validity besides that shown on a Standard certificate.
Yes: Age Allowance is a credit for age of 0.0325% of ratings increase for each year from Age or Series Date to the current rule year up to maximum of 15 years (0.4875%).
There is also a Dynamic Allowance (DA) credit representing the dynamic behavior of a boat taking into account performance in unsteady states (i.e. while tacking) calculated on the basis of: Upwind Sail Area/Volume ratio, Upwind Sail Area/Wetted Surface ratio, Downwind Sail Area/Volume ratio, Downwind Sail Area/Wetted Surface ratio and Length/Volume ratio.
DA is applied to the ratings of all Cruiser/Racers, as well as any Performance boats with a Series Date older than 30 years.
ORC Application
How to apply.
Read through the instructions below carefully. When you are ready to apply click the application button located below the instructions.
Our new application was built to gather information about an owner and their boat to issue certificates more accurately and efficiently.
Items to have on hand when applying:
- Boat ID - US Sailing has assigned a unique boat ID (SKU) to every boat that received an ORC or ORR certificate in 2022 or 2023. Owners should have received an email from US Sailing assigning a boat ID to their boat. The Boat ID powers the application, and will be needed to apply. If your boat has never been rated before, or you received an ORC or ORR rating prior to 2022 please use the New Boat Application below to apply for a rating.
- US Sailing Member ID – To obtain an ORC Certificate an owner must be a member of US Sailing. If an owner is not a member or needs to renew their membership, please use this link to learn more about our membership opportunities click here .
- Sail Certificates – Any new or remeasured sails that are being reported must have a sail certificate from the sail loft or a recognized measurer included in the application. If sails are being reported, the applicant will type in the measurements, measurer information, and sail certificate. Even if the sail is being replaced "same-for-same" the sail will need to be measured and reported.
- Crew Weight – Owners declaring a crew weight will declare their maximum weight on the application. If crew weight is not declared the default crew weight for the class/make of boat will be calculated by the VPP. Owners are highly encouraged to declare a crew weight. The declared crew weight is the maximum crew weight a boat shall sail at, as set by rule authority to sail within compliance of the certificate.
- First Race Information – On the application owners will declare the first race they are doing under the rule they are applying for a certificate under. Have the name and date of the boat’s first VPP race on hand. The Offshore Office will use this information to guarantee owners have their certificates in time to race.
2024 Certificate Application - Boats with a US Sailing Boat ID
Any boat that was rated in 2022 or 2023, will have received a unique Boat ID from US Sailing. A Boat ID will be needed to use this application. If you do not have a Boat ID, but received a certificate under ORC or ORR in 2022 or 2023, please contact the Offshore Office at [email protected] or call 401-342-7953. If you do not have a Boat ID, and were NOT rated in 2022 or 2023, please use the New Boat Application below.
2024 CERTIFICATE APPLICATION
New Boat Application - Boats without a US Sailing Boat ID
Any boat that did not receive an ORC or ORR certificate in 2022 or 2023 will need to be assigned a Boat ID by the Offshore Office. Please complete the New Boat Application below. Once submitted, US Sailing will contact you in 1-2 business days with your Boat ID. If you have any questions, please contact the Offshore Office at [email protected] or call 401-342-7953.
NEW BOAT APPLICATION
Application FAQ's
No, you are unable to save your application and return later.
If you have further questions please call the Offshore Office at 401-342-7953.
- Complete the Certificate Application located on this page.
- Complete the Sail Measurement Form and Hull, Rig, and Propeller Measurement forms if needed. If these forms are needed instructions on how to do so will be emailed to upon completion of your Certificate Application.
- Ensure that all sail certificates and data is submitted to USS either by boat representative or certified measurer (i.e. sail loft, or measurer).
- Ensure all measurement data is submitted by the measurer, if applicable.
- USS will contact boat representatives with a test certificate and invoice.
- Boat representatives review test certificate, click here for information on what to review.
- Boat representative approves certificate and pays invoice.
- USS issues final certificate and speed guide (if purchased). Copies will be sent to owner and boat representatives (if designated on application).
- Certificate will be uploaded to ORC
Once all of the input data (ex. sails, measurements, etc.) are submitted, US Sailing will run a test ORC certificate for your review. This will be sent to the owner email and boat representative (if applicable) email submitted in the application. The relevant boat parties will review the test certificate for accuracy.
In a separate email the owner or boat representative (if applicable) will receive an invoice for the certificate(s). This email will come from Authorize.net on behalf of US Sailing. The email often gets caught in a spam or junk folder so these locations may need to be checked.
Once the invoice is paid US Sailing will take this as approval of the test certificate and will issue the final certificate. The certificate is uploaded to ORC’s database of valid ORC certificates.
The Offshore Office processes certificates in order of event. When the office is ahead of schedule, they will process certificates for future events. All boats will have their certificate prior to the event indicated on their certificate application.
If the boat already has a current year ORC fully crewed, double handed, or non-spinnaker certificate then follow these steps to obtain an additional certificate:
- Launch US Sailing’s 2024 Certificate Application. Input Boat ID and contact information.
- On the Certificate Type page, select “ORC” as most recent certificate.
- Select “Additional Certificate”
- Select the type of certificate you wish to obtain (ex. Double Handed or Non-Spinnaker).
- Fill in necessary information including any sail differences and submit application. US Sailing will be in contact with a test certificate.
If the boat does not have a current year ORC Certificate, follow these steps:
- On the Certificate Type page, select the most recent certificate received, if applicable.
- Select “Renewal” if you are renewing a past year certificate. Select “New” if your boat has never been rated (New Boat Application ONLY).
- Select all certificate types that you need, i.e, Fully Crewed, Double Handed, Non-Spinnaker.
- Fill in necessary information and submit application. US Sailing will be in contact with a test certificate and invoice.
The Offshore Office implemented a new internal certificate processing system to issue certificates more efficiently, accurately, and in a more repeatable manner. This starts with our new database system, which organizes all certificate requests. To initiate any request an owner must fill out an application. This streamlines the process and allows for the removal of “fingers” in the data, creating a more accurate and repeatable system.
In future years the renewal process will be quicker and more efficient as the Offshore Office will have this data in their database. The 2024 application is the first step in this process.
The USS Offshore Office’s goal is to produce rating certificates that accurately represents a boat. This means getting some fingers off the keyboard. Each time data is re-typed there is a chance for errors. By having owners and boat representatives’ type in sail measurements directly which then feeds into a database we are cutting back on the amount of data we must re-type into the system.
Additionally, to help achieve more accurate sail data, sail lofts will be using a similar system. US Sailing has created a new digital sail measurement form for lofts to use when measuring sails. These forms are automatically sent to US Sailing and stored in a boat’s sail inventory.
Whenever sail data is submitted to US Sailing the Offshore Office checks each sail for errors and reserves the right to correct input mistakes as needed.
Sail lofts have a US Sailing developed tool to automatically submit sail measurements directly into the US Sailing system. This system identifies the boat and owner the sails are associated with. When the sails are submitted our office will attach the sails to your boat’s data file.
Therefore, you are welcome to apply before you receive the sail or after. If you would like to apply and get your information into our system, you will need to contact your sail loft to ensure they send the unreported sails to us through our Sail Measurement Form for sail lofts.
Addtionally, when you report you have new sails on your application, you will be sent a link to the Sail Measurement Form. Once you recieve the Sail Measurement Certificates from your US Sailing Recognized Sail Measurer, you can submit these new/remeasured sails.
If you receive a sail certificate for a new or remeasured sail and you believe the sail loft has not submitted the data to US Sailing, please contact us at [email protected] or call at 401-342-7953.
Other Resources
ORC Homepage
USA-CAN ORC Race Management Guide 2024
ORC Scoring Option USA and CAN 2024

Copyright ©2018-2024 United States Sailing Association. All rights reserved. US Sailing is a 501(c)3 organization. Website designed & developed by Design Principles, Inc. -->
David Burch Navigation Blog
Notes on marine navigation and weather
Tuesday, February 22, 2022
Introduction to polar diagrams and optimum vmc.
A polar diagram is a graphic presentation of a sailboat's sailing performance in various wind conditions. The same information is also often presented in the form of a table or spreadsheet, which is how the data are originally collected or computed, which in turn is then plotted on a polar diagram as shown below. Programs that compute this data are called velocity prediction programs (VPP).


macdavid@iMac Downloads % cat -e etap39.csv twa\tws,6,8,10,12,14,16,20^M$ 0,0,0,0,0,0,0,0^M$ 46.5,4.61,0,0,0,0,0,0^M$ 45.8,0,5.42,0,0,0,0,0^M$

No comments:
Post a Comment
- Boats & Gear
- Instructional
- Cruising Stories
- Cruising Destinations
- Race Results
- Race Reports
- Racing Technique
- Submit a Classified Ad
- Boats for Sale
- All Classifieds
- Terms & Conditions
- Your Dashboard
- Seattle Area Racing Calendar (SARC)
- 48° North Cruising Rally
- Croatia Flotilla
- Introduction to Polar Diagrams and Optimum VMC
- Seamanship & Navigation
A polar diagram is a graphic presentation of a sailboat’s sailing performance in various wind conditions. But how do you interpret it?
The same information is also often presented in the form of a table or spreadsheet, which is how the data are originally collected or computed, which in turn is then plotted on a polar diagram as shown below. Programs that compute this data are called velocity prediction programs (VPP).
Continue reading at DavidBurchNavigation.blogspot.com and see a video tutorial below.

David Burch
David Burch is the owner and courses director of the Starpath School of Navigation. An author and authority on weather and navigation, he has more than 70,000 miles of ocean experience ranging from the Arctic ice edge to Tahiti and Australia in the Pacific and from New York to Panama in the Atlantic.
Race Reports , Featured
First of Many – J/109 Spyhop’s Inaugural Southern Straits Race
April 19, 2024
Boats & Gear , Featured
My Boat: Didi 23, Koru
April 18, 2024
Featured , Events Coverage
State Parks to co-host Washington Coast Cleanup on April 20
April 17, 2024
April Products News
April 16, 2024
Boating News , Featured
Schooner Zodiac Celebrating 100th Birthday with Open House
April 15, 2024
Racing , Featured
J/24 Worlds Coming to Seattle in September
April 12, 2024
- AROUND THE SAILING WORLD
- BOAT OF THE YEAR
- Email Newsletters
- America’s Cup
- St. Petersburg
- Caribbean Championship
- Boating Safety
Take Your Polars Offshore
- By Stan Honey
- Updated: June 3, 2008
In the April ’08 issue we covered how to use your boat’s polar data and target boatspeeds to get to the next mark more efficiently. This month we’ll look at applying the same concepts to an offshore race, where the marks are farther down the course and there are a few more variables to contend with.
Let’s assume you’ve done your prep work and have your target cheat sheet posted in the cockpit and at the nav station. The trimmers and helmsmen are all on the same page. Everyone’s goal is to get to the finish as fast as possible. Your tactician or navigator will have already entered target waypoints into his routing software to best take advantage of projected and current weather conditions.
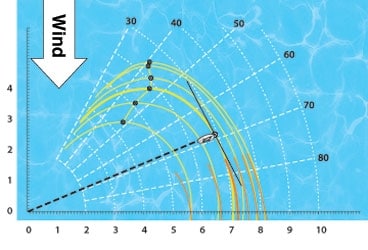
A common offshore strategy is to maximize your boatspeed to that next “mark.” We call this velocity made good to course (VMC). As it was for your buoy race, the polar curve you’ve gotten from your designer, or with US SAILING’s Performance Package, is a useful graphical tool. You can make a transparency of the polar plot, center it on the boat position on your chart, and align its vertical axis with the wind direction. If you then create a line perpendicular to the rhumb line to the next mark, shift the line until it is tangent to your polar curve. This will show you the wind angle that gives the greatest vector component in that direction. As shown in the diagram at right, this is easy to do with a pair of drafting triangles.
In our example, the rhumbline direction is 60 degrees. The solid black line is perpendicular to 60 and tangent to the polar curve at approximately 69 degrees. This is your heading to maximize VMC. You will not be heading directly to the mark, but somewhat further off the wind. The tactical expectation is that with all the wind shifts likely to occur over the course of this leg, opportunities will arise to compensate for not heading straight to your mark.
Calculation of optimum routes The most prevalent offshore use of polars is in conjunction with gridded binary weather data (GRIB files) to compute the optimum course for your boat. Software packages commonly used for this application include Deckman for Windows, Expedition, and Maxsea.
The polar file used with your routing software should reflect the boat’s actual average performance, including the fact that in light air offshore there is often a sloppy sea state, and in heavy air the boat is often sea-state limited and cannot be pushed above a seamanlike speed upwind in the typical sea-state associated with heavy air. Further, the boat’s average performance includes the full mix of helming skills, not just the performance of the best helmsman. So the polars you use for routing will end up being a separate file from your target polars. The routing polars need to be achievable. If you run a route on a GRIB file, and it turns out the first four days of the GRIB file forecast are accurate, in four days the boat actually needs to be exactly where the router calculated it would be. If your polars consistently overestimate your boat’s performance, and you don’t actually get to where the router calculates you will be at various times in the future, then the calculated route will not be relevant for your boat, and the routing software will be “playing” shifts you will never experience. There are, however, many pitfalls in computing optimum routes from polars. Lets look at them individually.
The weather forecasts (GRIB files) are not perfect. A typical GRIB file from the U.S. Global Forecast System (GFS) will contain forecast data extending out 15 days. The GFS data will be good for the first four days or so, but is less accurate further out in time. The routing algorithms don’t consider this decreasing certainty of the forecasts with extended forecast time. So, if you take a 15-day GFS GRIB file, and compute a transoceanic passage, you may find the router recommends an unconventional route based on the weather pattern that is forecast 10 to 15 days in the future. You know, but the router does not, that the 10- to 15-day forecast is much less certain than the forecast from 0 to 5 days. So the human navigator has to provide “genuine intelligence” (as opposed to the router’s artificial type). The human navigator has to consider the standard meteorological patterns and work out where you want the boat to be five days into the future based on standard climatology. The routing program can do a very nice job of optimizing how to play the near-term weather patterns to best get there.
Routing programs don’t adjust their computed routes for risk. For example, if there is a light-air area (e.g. high pressure) in your way, the routing program will skirt the area of calm very closely to minimize distance sailed. The routing program doesn’t consider that if the forecast is slightly wrong you could be becalmed, whereas sailing a few miles extra distance to position the boat slightly farther from the high could substantially reduce the likelihood of becoming becalmed due to an inaccuracy in the forecast. Some folks address these problems by editing the boat’s polars to artificially reduce performance in light and heavy air. That is one approach, but it has the disadvantage of causing the routing program to work less well in situations where you are forced to sail in light or heavy air. In such situations, if the polars do not reflect the boat’s actual performance, the router will not accurately estimate the boat’s future position and will calculate erroneous routes as a result.
So one of the most helpful uses of polars is the calculation of optimum routes, but the navigator must only use the router as a tool. It is still up to the navigator to consider the risks of the calculated route (very light air or very heavy air), and to consider the increasing uncertainty of the forecast with time. Often the best use of computer routing is for the navigator to calculate the route and then work with the router, trying different starting times, trying different sets of polars, putting in various artificial waypoints to force the route into a different area, and working out the estimated time en route (ETE) for various courses so that the navigator ends up with a clear intuitive understanding of what the weather is doing, what the best route is, why that is the best route, and how much better it is than the alternatives. The objective is for the navigator to completely understand the trade-offs and risks of the various routes in order to make a reasoned decision.
One technique to quickly understand the nature of the optimum route is to set up the routing software to display the forward and reverse isochrones. Take a look at the diagram above; the forward isochrones plot the locus of all the points, for each hour in the future, where the boat could be depending on the path it sails. So the forward isochrones are a family of curves surrounding the boat’s starting location. The reverse isochrones plot the locus of points for each hour prior to the boat’s expected arrival at the destination waypoint. When the forward and reverse isochrones are both plotted, the navigator can tell by inspection how important it is to sail the optimum route. If the forward and reverse isochrones run parallel to one another for a section of the course, for that region there is lots of flexibility in course selection that can be used to take advantage of local shifts or to cover competitors. If the forward and reverse isochrones just touch each other like the center of a figure eight, then according to the routing algorithm, it is important to take the optimum course. In this situation it is critical for the navigator to have a complete understanding of what weather characteristics are causing the optimum route to be so critical.
It is often useful to calculate the heading to sail to achieve the maximum instantaneous closing velocity to the next waypoint. If you know the wind will not change, you are better off pointing directly at the waypoint if on a reach, or sailing your VMG target angles and tacking or jibing if you are on a beat or run. If you are confident in the forecast, then you are better off calculating a route with your polars and the forecast GRIB file. If, however, you are sure that the wind will be shifty but you don’t know how and when, then it makes sense to sail whatever heading achieves maximum instantaneous closing velocity to the mark. This can be the case in light air when the wind is wildly shifty, or in locally turbulent conditions when no forecast makes any sense. You just shrug and do whatever you can to maximize your closing rate to the next mark. The logic is that all else being either equal or unknown, you might as well get as close to the mark as you can.
This calculation of the heading to achieve maximum VMC to the mark with the present wind direction and speed can be done from polar data by many instrument systems, by routing software packages, or can even easily be done graphically using the polar curves that come with the US SAILING Performance Packs. Instructions and examples are included with the Performance Packs.
Even on long offshore legs when you are sailing a computed route from GRIB files, it often makes sense to refer to the optimum VMC angle. If the boat’s heading is not between the direct course to the waypoint and the optimum VMC angle, it is important for the navigator to understand exactly why that is. Having said that, there are certainly reasons to sail courses that are outside the VMC angle; the first third of the Transpac nearly always requires such a course.
Performance assessment As described earlier in this article, when beating or running, the target table provides a good reference for the boat’s performance. If the boatspeed is not very close to the target values, that is a wake-up call to the crew to work out why. Maybe the boat isn’t trimmed correctly, maybe a sail change is necessary, maybe the boat has weed on the keel or rudder, or sometimes there is an unusual wind sheer or sea state causing the discrepancy. To assess performance on a reach you have to use the polar tables themselves. Many instrument systems can display on deck a reaching performance percentage number. This is simply the current boatspeed displayed as a percentage of the boatspeed predicted by the polars for the same conditions.
Just as with the target table when beating or running, this percentage performance number can provide the crew with a rapid indication that the boat is underperforming. If your crew is more able to quickly detect a trim, sail selection, or weed problem than your competitor, you will enjoy a significant advantage. This is particularly true when you are racing offshore or at night and cannot easily compare your performance to nearby similar boats.
- More: Sailing How To , Tactics
- More How To

The Wisdom of Augie Diaz

Why S-Turns, Roll Jibes and Roll Tacks Are Fast

The Path to Consistent Boatspeed

Headsail Trim Tips For Floating Leads

Wanderers of the Wayfarer Dinghy

Alinghi Red Bull Racing First to Reveal Its AC75

On the Line With US SailGP

Terhune’s Take On A Winning Streak
- Digital Edition
- Customer Service
- Privacy Policy
- Cruising World
- Sailing World
- Salt Water Sportsman
- Sport Fishing
- Wakeboarding
Boats & Polars
[vc_column_text pb_margin_bottom=”no” pb_border_bottom=”no” width=”1/2″ el_position=”first”]
Polars & Performance
Below is a collection of polar diagram from various sources.
Mostly in numerical format to easily plug into routing software. They’re published here just to play around with. For serious/real use you should get a real one for your specific boat. Also some links to tuning guides and other perfomance related info. Share and enjoy!
- 1D35 ( North , UK , Quantum )
- 606 ( Gransegel , Hamel , North )
- 806 ( trimguide )
- Albin Express ( Sten Bergqvist , Edman , North , Ottosson , UK Syversen )
- Albin Nova ( Blur )
- Beneteau 25 ( North )
- Capri 22 ( Ullman )
- Catalina 22
- Catalina 36
- Dehler 38/Pacer 376
- Drake ( Høj Jensen , North Tuning Guide )
- Etchells ( Doyle , North , Quantum )
- Farr 36 ( Farr Performance Prediction )
- Farr 40 ( Doyle , Farr PP , North , Quantum )
- Farr 395 ( Doyle , North )
- Fenix ( trimguide )
- Finn Flyer 36 Club
- First 34.7 ( Farr PP )
- First 36.7 ( Doyle , Farr PP , North , Quantum / pdf , UK / pdf )
- First 40.7 polar1 polar2 ( Farr PP )
- First 44.7 polar1 polar2
- First Class 8 ( North )
- H-båt ( Edman , Henrik Lundberg . Høj Jensen , North )
- IF ( Edman , North )
- IMX-40 ( X-yachts )
- IMX-45 jib only
- J/22 ( Haarstick , North , Quantum )
- J/24 ( Doyle , Haarstick , Jardine , North , Quantum , Shore , UK , Ullman )
- J/27 ( Ullman )
- J/35 ( Quantum )
- J/80 ( North , Shore , Quantum , UK , Ullman )
- J/105 ( Doyle , North , Quantum , Ullman )
- J/109 vpp-od / vpp-genua ( Doyle , North , North England , Quantum )
- J/120 ( North , Quantum )
- J/122 ( polar + pleliminary IRC cert )
- J/133 ( vpp )
- Landmark 43
[/vc_column_text] [vc_column_text pb_margin_bottom=”no” pb_border_bottom=”no” width=”1/2″ el_position=”last”]
- Melges 24 ( North , Quantum , Ullman )
- Melges 32 ( North , Quantum )
- Mumm 30/Farr 30 polar1 polar2 ( Doyle , Farr PP , North , Quantum + Cookbook
- Nelson-Marek 43
- Olson 25 ( Scot Tempesta )
- Prima 38 ( Quantum Tuning Guide )
- Santana 20 ( Ullman )
- Soling ( Doyle , North , UK )
- Sun Fast 3200
- Sydney 36CR
- Sydney 38 ( North )
- Swan 42 “ClubSwan” ( North , Quantum )
- Swan 45 ( B&G , Hall . North , Quantum )
- Tartan 10 ( Doyle , North , Sobstad )
- Ultimate 20 ( Ullman )
- X-35 polar1 , polar2 ( B&G , North )
- X-99 ( North , X-yachts )
- X-332 ( trimguide )
- X-332 Sport
- Yngling ( Doyle , Høj Jensen , North , Ullman )
Various sources for IMS ratings with VPP-data:
Just for reference I collected a bunch if IMS certificates here .
I also collected lots of IRC numbers, just for reference. Sorted by boat type and sorted by Time Corrector (TCC) .
Pelle Lindell did some excellent comparisons between LYS, IRC, IMS, ORC Club and PHRF: “ Käpp eller rullator, handikapp för seglare – En jämförelse av olika handikappsystem ” + spreadsheet .
Various sources on trim/tuning (Swedish):
- Bodings lilla röda
- Hamel trimtips
Various polars from Sailinline.org .
- Albin Express
- Bavaria 38 Match
- Comfortina 38
- Dynamic 3000
- Finngulf 33
- Grand Soleil 341
- Grand Soleil 37
- Grand Soleil 40
- X-41 ( assy for pole )
[/vc_column_text]
49 Comments
blur » Blog Archive » Polardiagram Dec 18, 2006 @ 12:17
[…] Jag har sammmanställt en del polardiagram för olika båtar här. Kan vara intressant att labba med om man skall byta båt (eller bara på kul). […]
blur » Blog Archive » Wrap Up 2006 - bloggen Dec 28, 2006 @ 22:18
[…] Sökt på Google: vad är det folk har sökt på när de kommer till blur.se? I fallande ordning ‘Maria Cattiva’ (>500 klick), ‘polardiagram’, ‘Tjörn Runt’, ‘Blur’, ‘x-35′, ‘Albin Nova’, ‘Bengt Falkenberg’, ‘Hermanö Runt’, ‘Gotland Runt’ och över 2.000 andra sökord. […]
Trimguider « Aiming First Apr 23, 2007 @ 22:06
[…] Jump to Comments Her er en liste over trimguider på nett. Les og kos […]
Hi, I went to your Web page looking for polar diagram or data for Tartan 10. I found the tuning guides but not the performance prediction. If anyone has one please let me know.
Thanks, Ron
I also am looking for T-10 polars; are any available?
Hi guys, given that there’s a lot of people from Scandinavia here I figured I’d ask the question; Has anyone come accross the polars for the dJUICE VO60 or any of the other last generation VO60’s. Please let me know,
Hi Euro, I have ORC polar data for VO 60 but only in paper format, so I have to rewrite them and then send it to you.
Please, let me your e-mail.
Peter, Det finnes et ferskt IMS-målebrev for IW 31 FIN 6313: http://www.avomeripurjehtijat.fi/certlist/?boat=L-6313&content=pdf
Jeg har plottet polardiagrammet her: http://iw31.blogspot.com/2007/10/s-fort-br-vi-seile-polardiagram-for.html
Anyone with polars for :
Benateau One Ton ?
Would appreciate it.
I’m looking for polars for an Etap 30. I’m hoping someone across the Atlantic that races an Etap 30 might be able to help me.
Thanks! Carl
Please, is it possible the polars for X-40 with genoa 135% or genoa 105%.
Thanks Lakis
Do you know where I can get a polar diagram for Capri 22?
Noen som kan hjelpe med å tyde polardiagrammet for First Class 8?
I am looking for catalina 38 polar diagrams? Or suggestion how to calculate them ?
any one have a polar or tuning guide for a Delher 22/Dehlya 22? thanks
Any polars/performance for the new First 45 with Carbon Rig and deep keel?
Here are some Dehlya 22 polars from IMS VPP (with oversized 36 m2 spinnaker). Displacement and RM are not accurate, but I found the target speeds to be OK.
The boat is very fast for it’s size and age when the wind is 10 kn or less. In stronger winds it’s speed is limited by the short waterline and the hull form that is very difficult to get out of displacement mode.
TWS, BSP, TWA, BSP, TWA 6, 3.79, 43.9, 3.67, 148 8, 4.63, 43.4, 4.61, 150 10, 4.77, 40.5, 4.81, 165 12, 4.85, 39.4, 5.17, 170 14, 4.91, 38.8, 5.52, 172 16, 4.95, 38.6, 5.80, 173 20, 4.98, 39.2, 6.35, 172
Joakim. Thanks for these figures! As a new owner of a Dehlya 22, I’m interested in the target speeds of my boat. But how can I transfer these numbers into a polar diagram? Do I need specific software for this? Do I read it right as TWS = True Wind Speed, BSP = Boat Speed, TWA = True Wind Angle? As I understand the angles, they represent the wind angle producing the maximum boat speed when tacking, and reaching. But what about the other wind angles?
Eric, you can use a spreadsheet like Excel to present these figures in graphical format. You would of course need the “other” angles too, they are found in the boats ORCc/i certificate – maybe Joakim can help you to find one?
Here are all the data for Dehlya 22. Note that TWA includes leeway. Hope you can read it. I don’t see any use of making the polar diagram. Just pick some values from the table and compare.
Wind Velocity 6 kt 8 kt 10 kt 12 kt 14 kt 16 kt 20 kt Beat Angles 44,0° 43,5° 40,3° 39,1° 38,5° 38,2° 38,5° Beat VMG 2,65 3,28 3,58 3,72 3,81 3,87 3,89 52° 4,15 4,89 5,19 5,38 5,48 5,54 5,59 60° 4,57 5,06 5,37 5,58 5,69 5,75 5,81 75° 4,80 5,35 5,64 5,76 5,95 6,07 6,17 90° 5,00 5,49 5,81 6,00 6,10 6,19 6,46 110° 4,91 5,40 5,76 6,07 6,35 6,55 6,77 120° 4,75 5,28 5,67 5,98 6,30 6,59 7,04 135° 4,15 5,00 5,43 5,77 6,07 6,37 7,01 150° 3,52 4,54 5,10 5,49 5,80 6,09 6,67 Run VMG 3,05 3,93 4,59 5,04 5,40 5,69 6,22 Gybe Angles 147,6° 149,5° 164,6° 169,7° 171,5° 172,9° 172,3°
Polar diagram might come handy, if you are intrested in optimising VMC, on longer offshore legs perhaps…
Otherwise, it’s just as Joakim says, pick your target and compare. You will however have to calculate your target speed: TBS=VMG/cos(TWA). And note also, that in the range 0…10 kn the TBS changes quite rapidly, so the wind (TWS) should also be measured accurately.
Thanks a lot! Now I can compare my performance, and check the best course! As you say, the graph is not necessary, It’s the data I need.. It will help me to improve my sailing :-) Eric
Looking at the data, I’m not sure I understand it all :-( TWA 90° means: wind 30°; course my GPS 120° for example? And: if the wind blows 6 kt, and I sail 90° wind angle, I should be able to do 5 kt? I was comparing the data to the Dutch ORC-data I have for Dehler Sprinta ( http://www.watersportverbond.nl/data/8F2_Sailspeed.xls ), and it is suggested that the Dehlya is faster, allthough smaller??? Thanks again for explaining, and helping me! Eric, Senior; but Junior Racer…….
As I said this data was with an oversized spinnaker, which is actually 38 m2 with the ORC formula compared to 33 m2 of Sprinta Sport, which should do 5,0X kn at 6 kn 90 (checked two boats).
Even with a more typical spinnaker of 28 m2 the Dehlya 22 should do 4,89 kn at 6 kn 90. As I said it is a very fast boat for its size and age in light winds. Size doesn’t count that much in light winds and you should be able to sail faster than many bigger boats at 6kn.
Any polars for a mumm 36?
4 or 5 at http://www.ssf.se/tk/pdf/cert2008.asp
Hej! Nu finns det polardiagram för Beneteau First 32s5 här http://www.sailstarck.com/Forum/tabid/53/mid/369/threadid/7/scope/posts/Default.aspx#43
Noone has any polars or tune details for the Beneteau First 45 with carbon rig and deep keel ?
I’m looking for polars for X 40 (1985) with 120% genoa. Who can help me? 11 Lakis: have ever had an answer? Thanks, Frank
I’m sorry, I mean 130% genoa (N° 29)
Thanks for the Dehler 22 info the boat is very quick in light air
Does anyone have polars for Scampi Mark IV.? Help.
Any polars for First Class 10????
Good Morning,
Any polars for a Bavaria 34, long keel, year 2000 manufacture?
Bernard Bodin
Joakim you state that a Delher 22 is difficult to get out of displacement mode could you give an explanation and ideas on optimizing for this condition. thanks
What kind of optimiazation are you talking about? The hull form is not designed for semiplanning speeds, thus it needs big waves to get over 7 kn and still the average speed will be below 7 kn. At least I was newer able to sail faster than 7 kn for more than a couple of minutes or so and that was in ~15 m/s wind with the big spinnaker.
I have not had the opportunity to sail my boat in strong down wind condition but other than a rather fine entry and the stub keel it would appear that it should be quite easy to sail fast down wind. I calculate a D/L of under 150. I was wondering if it is worth raising the keel or using a masthead chute. As this is a rare boat here in the states there is not much in English to go on. I rate in PHRF 234 which is very generous when looking at how fast the boat is in light conditions but not sure if it’s worth the penalty for a larger chute. My boat is rather bare below so no excess weight . Thanks for you response my blog for the boat is http://mysorellina.wordpress.com/ I also race on a Kirby 25
I think the D/L-ratio is close to 200. The waterline is about 5.5 m and the displacement in sailing condition (without crew) likely around 1,2-1,3 tn. I did never put my Dehlya on a scale, but I did quite a lot of queries from the German owners and ended up estimating my Dehlya to 1,3 tn. The official value is 950 kg (or even 900 kg), but it is not clearly stated whether it contains the 200 kg of water ballast. But then using the official WL of 5.2 m with 950 kg ends up close to 200 as well. Thus it is not a light boat! Or have you better knowledge of the displacement?
I don’t know much about PHRF and the fleet is very different here, but picking up some familiar boats 234 sounds very easy to sail to: http://www.ussailing.org/phrf/Tool_%20HI_LO_AVG%20Report.pdf I had a LYS of 1.02, which meant I needed to be 2% faster than Albin Vega, 1% faster than Avance 245 and equal to Beneteau First 24. With that rating I did well under 5 m/s and lousy over 6 m/s.
Sure it might help to lift the keel, but it takes quite long and also reduces stability quite much, thus not very safe when it blows. The mast has quite a long unsupported part and putting masthead chute to that needs some care. The boat does not carry well a big chute when it blows.
Instrument & routing på 5 kvällar | BLUR Jul 25, 2009 @ 22:51
[…] svensk segling och kappsegling Skip to content HomeBoats & PolarsAlbin NovaJ/109Gallery 2007Gallery 2008RacesFærderseilasenGotland RuntSkagerrak TwoStarTjörn […]
Yacht polars | Purepassionbyk Jun 12, 2012 @ 23:02
[…] Boats & Polars | BLURPolars & Performance Below is a collection of polar diagram from various sources. … For serious/real use you should get a real one for your specific boat. […]
Polar Files | RudderNut Jun 25, 2012 @ 16:40
[…] files for various boats can be found on the internet. Here is an example file Catalina 36 from the http://www.blur.se site. The file is text, and though this example has a “.txt” extension Tack Pad […]
Polar Tables - SailNet Community Nov 20, 2012 @ 01:40
[…] Polar Tables Not much help to the OP, but here's a site with quite a list: Boats & Polars | BLUR __________________ ".. there is much you could do at sea with common sense.. and very […]
Understanding the Polar Diagram - Page 2 - SailNet Community Nov 10, 2013 @ 17:53
[…] image while searching Polar speeds, look at manufacturers boat catalogs, on site like this one> Boats & Polars | BLUR On a ORC certificate you will not get a polar but something similar to what Bob Perry posted about […]
Appar sjöväder och prognoser - tips för seglare Mar 17, 2016 @ 09:33
[…] Vilken är högsta farten på alla bogar i alla vindar? Två bra källor till polärdiagram är: http://www.blur.se/boats/ och http://www.orc.org/index.asp?id=1 (där man behöver logga in och ibland betala för […]
I’m looking for Polars for a Cal 35 MK1
Hey Matt, any luck to find them? Im looking for the same Polars
Hi. I´m Fernando from Argentina. I have a J/24 I am looking for the J / 24 polar chart.
Here in Argentina we sail with jib 0% and a maximum crew of 340kg. So, the polars that I need would be with jib and not genoa. Do you have the information? Thank you very much.
Fernando & Crew.
Any information for Sprinta Sport? An E.G. Van derStat one design built by Dehler. Thanks.
Hi just wondering if anyone has come across the polars for Sun Odyssey 389 standard keel
Leave a Reply Cancel reply
Your email address will not be published. Required fields are marked *
This site uses Akismet to reduce spam. Learn how your comment data is processed .
Weather Routing
Introduction:, getting started, user manual.
Modeling vessel performance at sea can be enormously complex.
A short, and incomplete list of some of the factors that may affect the performance of a vessel at sea are:
- the type of vessel, its size and shape, above and below the water line.
- the wind direction and strength.
- the sails the boat is carrying, and the condition they are in.
- the combination of sails the boat will fly in different wind and sea conditions.
- how frequently the crew is willing to change sail combinations.
- if the crew has different sail combination rules during daylight and at night.
- the vessels average motoring speed.
- the vessel speed heading into, across and running with various wind speeds.
- the wave state (direction, height and period for wind waves and swell.)
- any leeway created by hull shape, wave state and amount of heel.
- the condition of the crew (are they fresh or tired?)
- the comfort / discomfort the crew is willing to put up with.
- the risk appetite of the crew (conservative or not.)
- the voyage length and willingness to accept damage to the boat.
- how clean is the vessels bottom (is it covered in barnacles?)
Any computer simulation of a vessels performance is only going to be an approximation of its true performance. The weather routing system will be unable to exactly match your vessels speed in its calculations. However, even a close approximation to your vessels performance will allow you to gain valuable insight into weather systems and how your vessel may move through them.
Creating performance data.
There are a variety of ways people have come up with to create these vessel speed estimates.
Two of the main methods of creating vessel performance data are:
- actually measure the vessel performance in a wide range of conditions.
- use a computer simulation of the performace using a system called a Velocity Prediction Program , or VPP .
Both of these methods can create a table of condition/speed values. The most common way to present these tables is in something called a Polar Diagram . The term Polar Diagram , or Polar is often used to refer to the performance data itself.
Sailboat Polar diagrams.
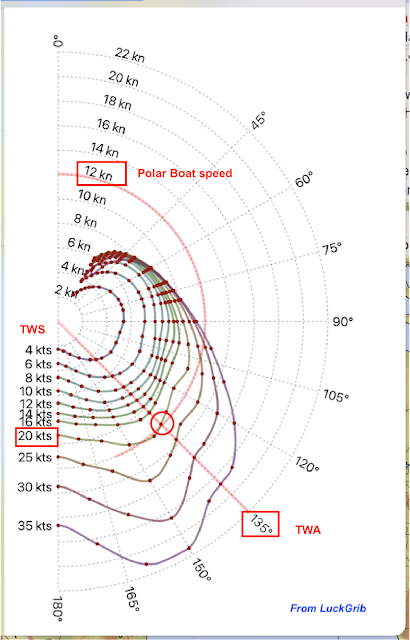
Here is an example of a polar diagram, as presented in LuckGrib:

There are a few points to know when reading this diagram:
- the top of this diagram, labelled 0°, is the bow of the boat.
- the bottom, labelled 180°, is the stern.
- this diagram is symmetric for port and starboard, only starboard is shown.
- the polar diagram is a radial graph with boat speed being zero at its center and increasing as the graph moves out. The maximum boat speed shown on this graph is 8 knots.
In the example diagram above, there are 7 wind speed performance curves. Each curve represents a true wind speed. This diagram is modeling vessel performance for the wind speeds: 6, 8, 10, 12, 14, 16 and 20 knots.
A point on any of those performance curves represents the true wind angle of the wind, and how fast the boat will travel for that combination of true wind speed and true wind angle.
Reading the diagrams.
After becoming familiar with polar diagrams, you can read them and see how a vessel performs in various wind combinations. For example, the vessel above sails much slower dead downwind than while reaching. Notice that the speeds at 180° are much slower than at 135° or 90° for example.
It looks like this boats fastest sailing angle is around 130° true (this true angle will of course move forward when you consider apparent wind speeds and angles.)
Interpolation.
The actual polar file will contain relatively few data points. In the example polar diagram above, the red dots represent actual data points from the file. Across each wind speed interval provided in the file, the system is generating smooth interpolations.
Notice that the file does not contain a data point for when the true wind angle is 0°. For sailboats, the assumption is that the boat speed will reach 0 knots when the true wind angle is 0°.
In order for the weather routing system to solve its routing problem, it needs to determine the vessel speed given a combination of true wind speed and angle. The application will generate interpolated values, based on the polar diagram, for the requested evaluation points.
Solver settings.
There are two cautionary notes regarding the interaction beween the weather router solver and these polar diagrams.
The first cautionary note is regarding impossibly high sailing angles. Note above that there is an assumed boat speed of 0 knots at a 0° true wind angle. However, the speed curve will fall smoothly from the last data point in the file to 0 knots. This can be seen by examing the isochrones from the solver. For example, here is an image presented earlier:

Notice that the speed is falling slowing from a high wind angle down to 0 knots. However, there are many sailing angles that are impossible in that picture. A sailboat will not be able to sail at 10° to the wind.
LuckGrib allows you to set sailing angle limits, both upwind and downwind. So while the polar diagram may be reflecting impossible wind/angle combinations, you solve this easily by changing a setting and telling the solver what your upwind and downwind sailing limits are. For example:

This picture shows the first isochrone for the same vessel as in the previous picture, but with the upwind sailing limit set to 35° apparent and the downwind limit set to 165° true. The yellow lines indicate headings that are invalid due to their violating the upwind angle limit, the orange lines are violations of the downwind limit.
Only the sailing angles which do not violate the limits are considered by the solver. The paths generated will respect the sailing angle limits you set. There is no need for these limits to be represented in the polar diagram file.
The other cautionary note is that if the weather router encounters wind speeds which are beyond the maximum value in the polar diagram, the system will assume that the vessel speed will match that on the highest wind speed curve provided. This implies that you would reef the boat down as the wind speeds increases and maintain the boat speed. This may not be realistic.
There are settings available in the LuckGrib WR system that allow you to avoid areas where there is too much wind for your comfort, or to heave to when the winds become too strong.
Obtaining your polar diagram.
If you have a polar diagram file from your vessel manufacturer or a VPP calculation, you can import the file and use it. Also, LuckGrib comes with a catalog of polar diagrams for a variety of vessels.
There are a number of ways for you to adjust the polar diagrams so they more closely reflect your vessels performance. You can use these tools to quickly adjust a polar which is similar to your vessels performance, but not exactly the same.
For example, if the catalog has a sailboat similar to yours but for a different length, and you think that the general shape of the performance curves are a good match for your vessel, you can use the sample from the catalog and easily apply a scale to its speeds.
You may find a sample polar which has a good shape match to how your vessel performs from other manufacturers as well. When looking for a sample polar to start with, consider similar boats, from the same or other manufacturers. The sample you start with can be adjusted to more closely match your boat.
Read the manual.
There is additional information in the manual on this topic.
Copyright © 2020-2023 Craig McPheeters. All rights reserved. | LuckGrib Privacy Policy

All Articles
Polar Performance
October 5, 2023 • 5 min read
How to think about your polar diagrams.

Polar diagrams help you predict how fast you’ll sail for a given wind angle and wind speed.
These diagrams are fantastic tools to help you understand how well you are sailing compared to your optimal performance – and with advanced sail systems like Orca, they make preparation ahead of a sailing trip or a race a lot easier.
But for polar diagrams to be helpful, they must be accurate.
Maybe you’ve heard a sailor say with a sense of pride: “I averaged 130% polar performance on the last leg”. At Orca, we believe that consistently beating your polar makes no sense, and an experience like this should warrant a review of your polar diagrams.
Inaccurate polar diagrams can often do more harm than good, as they will give you inaccurate routes and make it hard to understand and improve your sailing performance. This article explains how we think about polars at Orca, how to set them up, identify if they are accurate, and what to do if you are unable to hit your polars.
How to think about Polar Diagrams
Conceptually, we recommend you think of your polar diagram as a representation of your boat’s “perfect sailing performance in ideal conditions”. Your polar should represent the maximum performance your boat can achieve in a perfect scenario.
By keeping your polar baseline relative to your perfect sailing performance, you’ll have fixed target metrics that work together with your intuition to tell you when you are sailing well.
If you constantly readjust your polars based on your crew, sailing intent, and sea state, it will be a lot harder to identify abnormalities and potential improvements in your sailing.
When you know you’ll sail slower than your performance baseline, such as when you are cruising casually or sailing in a bad sea state, Orca gives you the tools to adjust.
Setting up your Polar Diagram
Setting up polars in Orca is easy. From Main Menu > Settings > Vessel > Polar Performance , you’ll have two options:
Search for your boat or boat type in the ORC database
Set up a Custom Polar Diagram
Offshore Race Committee (ORC) Polars
If you have an ORC certificate, or if your boat type is in the ORC database, you should use an ORC polar as a starting point for your polar in Orca.

Search for polars in the official ORC database. Orca also includes non-spinnaker and shorthanded polars.
Keep in mind that your ORC polar may not represent your actual performance. Even if you have an ORC certificate for your specific boat, you may find yourself in need of adjusting your polars via the Custom Polars screen.
Custom Polars
If your boat type is not in the ORC database, you can create a custom Custom Polar.
When creating a Custom Polar Diagram, you’ll first be asked to enter performance targets for 10 knots wind speed. From your 10 knots polar, Orca will extrapolate your performance targets to the remaining wind speeds from 6 to 20 knots. From here, you can fine-tune every part of your polar to the decimal.

Create a custom polar, or tweak an ORC polar to your true sailing performance.
Your boat manufacturer should be able to provide you with a good baseline polar. If you are not able to find any, look for polars of boats with roughly the same hull shape, weight, rig, and manufacturing year as a baseline.
How Polar Diagrams are used in Orca
Polar Diagrams are used for three systems in Orca: Laylines, Instruments, and Routing.
Laylines help you project where you’ll go if you follow your polar beat or run angles. Instruments help you understand how quickly you are sailing relative to your polar performance targets and routing uses your polar and wind forecast to find the best path to your destination.
Each of these systems depends on your polars and also helps you identify potential accuracy issues.
Laylines are shown as extensions from your location mark in the chart. To calculate your laylines, Orca takes into account:
The run angle and beat angle from your polar diagram
Leeway, which Orca calculates from your heel angle and boat speed
Effects of tides and sea state based on the difference between STW and heading against your COG and SOG over time
Polar diagrams define the baseline angles for your laylines. Because of this, you want to make sure your beat angles are accurate.
Laylines are shown in the chart. Sailing is sped up 5x to illustrate wind shifts.
To identify your beat angles, you want to sail upwind in moderate winds in an area with little to no tides. Adjust your true wind angle to see which angle gives you the best upwind VMG. If your laylines don’t match when you see the highest upwind VMG, you should adjust your polar.
Identifying accurate run angles is more complicated, and requires logging for accurate results because boat speed and VMG vary a lot less for changes in True Wind Angle compared to beat angles.
We generally recommend you stick to run angles provided by your boat manufacturer or ORC rating polar.
Polar Performance Instruments
Orca gives you instruments that tell you how well you are sailing compared to your polar diagram. These can be found in the Sailing Performance category, and are:
Target Boat Speed – your expected boat speed at the given wind speed and angle
Target Beat Angle – your optimal True Wind Angle at the given wind speed when going upwind
Target Run Angle – your optimal True Wind Angle at the given wind speed when going downwind
Target Beat VMG – your expected upwind VMG at the given wind speed
Target Run VMG – your expected downwind VMG at the given wind speed
Polar Performance – gives you a percentage value of current boat speed against your target boat speed
If you are interested in tracking your sailing performance and understanding the accuracy of your polar, you want to add the Polar Performance instrument to your primary sailing instrument panel.

A great example of polar instruments that let you compare your actuals against your polar targets.
If you are able to hit 100% polar performance when you sail at your peak performance, your polars are well-tuned. You want to adjust your polar speed targets if:
You are sailing above 100% polar performance, constantly or at certain wind angles or speeds
If you are unable to reach close to 100% when sailing perfectly
If you are cruising, and not putting effort into sailing at peak performance, you should not expect to hit 100% polar performance. In that case, we do not recommend you adjust your polars to offset your sailing effort.
Sail Routing in Orca uses your polar diagrams along with the weather forecast and chart data to find the fastest path to your destination.

Downwind sailing from Plymouth to Southampton. Orca's sail routes do multiple course corrections to find the best wind and tide conditions.
By using Layline and Polar Performance Instruments as benchmarks, you’ll be able to understand how well you are sailing and in turn how you are progressing along the planned route compared to what the Sail Route expects you to.
More accurate polars mean more accurate Sail Routes. Even small variations in a polar diagram can give large deviations in routes – in particular, longer routes where Sail Routing has greater freedom to find specific weather systems.
You want accurate routes and you want accurate ETAs, even when you are not sailing at peak performance. When this happens, Orca gives you the tools to adjust your routes to your sailing.
Next week’s release introduces two new route settings that give you representative Sail Routes when sailing under non-ideal conditions or non-peak performance:
Performance factor – reduce boat speed and increase beat angle compared to your polars
Night compensation – reduce boat speed from dusk to dawn
Custom Polars, along with the upcoming Performance Factor and Night Compensation make for a lot more accurate routes, while giving you consistent performance targets that help you understand your sailing performance.
We’re also working on automatically setting these performance factors. Very soon, you can sail freely and let Orca monitor and adapt to your performance as you go.
Better sailing with Orca
Orca is the only navigation system that combines laylines, performance instruments, and sail routing with an incredibly accurate sailing processor .
With these experiences in a single system, you’ll have all the tools you need to uncover the fine details about your sailing performance – and have more fun sailing.
If you want to sail better and plan better, head over to the Orca Store to order your next-generation navigation system.
Which Orca is right for you?
Get a personal recommendation >

2024 © Orca. All rights reserved.
- New Sailboats
- Sailboats 21-30ft
- Sailboats 31-35ft
- Sailboats 36-40ft
- Sailboats Over 40ft
- Sailboats Under 21feet
- used_sailboats
- Apps and Computer Programs
- Communications
- Fishfinders
- Handheld Electronics
- Plotters MFDS Rradar
- Wind, Speed & Depth Instruments
- Anchoring Mooring
- Running Rigging
- Sails Canvas
- Standing Rigging
- Diesel Engines
- Off Grid Energy
- Cleaning Waxing
- DIY Projects
- Repair, Tools & Materials
- Spare Parts
- Tools & Gadgets
- Cabin Comfort
- Ventilation
- Footwear Apparel
- Foul Weather Gear
- Mailport & PS Advisor
- Inside Practical Sailor Blog
- Activate My Web Access
- Reset Password
- Customer Service

- Free Newsletter
What You Can Learn on a Quick Test Sail

Cabo Rico’s Classic Cutter

Bob Perrys Salty Tayana 37-Footer Boat Review

Tartan 30: An Affordable Classic

Preparing Yourself for Solo Sailing

Your New Feature-Packed VHF Radio

Preparing A Boat to Sail Solo

Solar Panels: Go Rigid If You have the Space…

When Should We Retire Dyneema Stays and Running Rigging?

Rethinking MOB Prevention

Top-notch Wind Indicators

The Everlasting Multihull Trampoline

Taking Care of Your 12-Volt Lead-Acid Battery Bank

Hassle-free Pumpouts

What Your Boat and the Baltimore Super Container Ship May Have…

Check Your Shorepower System for Hidden Dangers

Waste Not is the Rule. But How Do We Get There?

How to Handle the Head

The Day Sailor’s First-Aid Kit

Choosing and Securing Seat Cushions

How to Select Crew for a Passage or Delivery

Re-sealing the Seams on Waterproof Fabrics

Waxing and Polishing Your Boat

Reducing Engine Room Noise

Tricks and Tips to Forming Do-it-yourself Rigging Terminals

Marine Toilet Maintenance Tips

Learning to Live with Plastic Boat Bits
The predictive value of polar charts at sea.
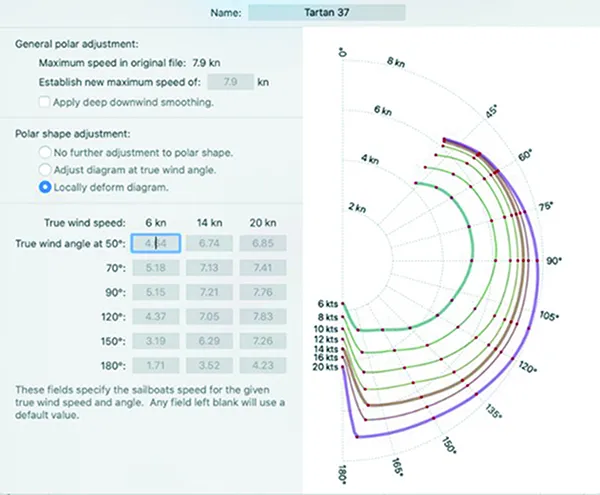
Weather routing requires the vessel’s polars, or at least a generic polar that is close to yours. The version of the 4D program we tested had four polars pre-loaded, including a First 31.7, X37, and a Hanse 495. We attempted to load different versions of the polar for my Tartan 33 and had errors. Because 4D does not include a polar editing feature, we could not adapt one of their polars for our test boat.
LG uses a different approach. From the initial drop-down menu, one selects the “Routing” option. This brings a sub-menu where you define a vessel. We added our boat, then I went to the “Sailing Polars” menu where we imported the same file that was rejected by 4D. Had we not wanted to import the polar, or if we did not have a polar,we could have gone to the “Sailing Polar Diagram Catalog” option. The LG polar catalog lists about 100 different vessels.
Motoring polar
LG also offers a “Motoring Polar” menu. For those not familiar with the concept of a motoring polar, every boat operates differently under power. Also, when hopping across the bay, you may run at 2300 RPM, but on a crossing you would run at 1800 RPM to save fuel.
The user enters into an input screen the following information, calm air boat speed, boat speed with 25 knots and true wind angle (TWA) of 0, 90, and 180 degrees, and boat speed with winds 35 knots and TWA of 0, 90, and 180 degrees. This importance of this feature was made clear in our sea trial of the product.
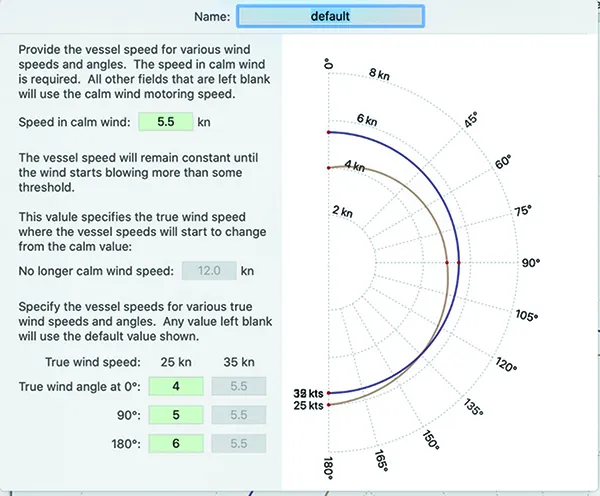
Neither LG nor 4D track GPH, or cumulative fuel consumption. The ability to compare that to allotted tankage, would be a great planning tool. For example, if the model forecasts 80 hours of motoring and, based on user input, the vessel burns 0.75 GPH and the tankage is 60 gallons, then you know that either additional fuel is needed for a safety cushion, or you will need to sail slowly.
- Privacy Policy
- Do Not Sell My Personal Information
- Online Account Activation
- Privacy Manager
- Forums New posts Unanswered threads Register Top Posts Email
- What's new New posts New Posts (legacy) Latest activity New media
- Media New media New comments
- Boat Info Downloads Weekly Quiz Topic FAQ 10000boatnames.com
- Classifieds Sell Your Boat Used Gear for Sale
- Parts General Marine Parts Hunter Beneteau Catalina MacGregor Oday
- Help Terms of Use Monday Mail Subscribe Monday Mail Unsubscribe
Can Anyone Source Hunter Polar Diagrams
- Thread starter Mark D'Etcheverry
- Start date Feb 15, 2004
- Forums for All Owners
Mark D'Etcheverry
Can anyone tell me where to find Polar Diagrams for Hunter boats (specifically the 240)?
US Sailing US Sailing has polars for a number of boats, but you may be disappointed with the few number of Hunters available. At one time they had a list of boats available, but I wasn't able to find it to check the 240. Also the cost is just a tad high... Steve
Thanks, Steve Indeed pricey. Thanks for note...Mark
Cliff Ruckstuhl
Not there Hunter only had Polars done for the 35.5. This is something Hunter would have needed to do and last time I checked the 35.5 was the only boat. They did this for the Liberty Cup boats back in the late 80's early 90's. They used the 35.5 for some match racing and these boats are still out ther some where but they needed the Polars for the Match Racing. Some footage of it is on the Hunter Video. CLiff H 28.5 "Red Dog"
Hey Cliff I've been trying to get my hands on polars for my 35.5 since I bought her with no luck. The ones that US Sailing had were for a modified boat with a custom mast. If you have any idea where I can get my hands on those polars for the Liberty Cup boats I would appreciate it. My boat is set up a lot like that. By the way I have that video of the match racing in Bermuda.
Hey Alan I remember talking to US Sailing trying to get Polars for my 28.5 and they told me they only had info on the 35.5. I assumed it was becasue of the Liberty Cup Regatta. Getting Polars is something the Boat manufacter would need to do at time of production. Or it could be done for private use but at a fairly good cost. In the Hunter video they show a short segment of the Liberty Cup. Cliff
Peter Milne
What are Polar Diagrams?? Can someone explain what Polar Diagrams are and what they do? Are they useful for non-racers? Thanks Peter Milne S/V Blue Heron
What are racers?? The "racing" guys are sailors that want to make their boats perform to their potential. The science that is sailing is the same for cruisers and racers. Racing sailors have a need to learn all there is to know about making the boat perform. Cruisers are basically not interested in this. Polars are diagrams drawn to show how any given sail will perform in any given wind speed and direction for a specific hull. Having these (polars)diagrams makes it easy to choose the best sail and sailing angle for optimum up wind or down wind VMG.
Make your own... Polars are simply a graphic presentation of a table of performance on a particular boat. They can be built by tracking wind conditions and boat performance in a spreadsheet or chart, and then plotting the results. FYI, if you have Raymarine's RayTech Navigator charting software, they have just reciently opened up the Sail Racer program as a standard feature in version 4.1. This builds the polars for your boat as the data is entered. You have to ask them for the key, but I suspect that version 5.0 is due to be released very shortly, and will have the feature as well. Steve
True, I've been doing that... ....but it is very time consuming. Frankly I'd rather be sailing, as that bumper sticker says. Anyway it sounds like Raymarine is on the right track putting that software together. I would like to see it in action.
Polar Diagrams are usually generated... ...by running a Velocity Prediction Program (VPP). The VPP has algorithms that incorporate hydrodynamic and aerodynamic mathematical models of a sailboat based on the physical input parameters of a particular sailboat. The software program generates results that predict how fast a particular sailboat will perform in varies points of sail. The predicted speed is the Velocity Made Good (VMG) or target speed of the sailboat, it's the theoretical best speed the sailboat can make based on the wind angle and speed. For example, base on a hypothetical polar diagram a sailboat sailing with a wind speed of 10 knots; the best angle to sail upwind is 40 degrees which will give you a VMG or target speed of 6 knots. If that same sailboat fell off to an angle of 35 degrees the boat speed would be 5.6 knots. The Polar diagram determines the optimum sailing VMG or target speed to get the boat into the groove as quickly as possible while racing. If you generate polar diagrams using chart plotting electronics, the polar diagrams are polar diagrams of how well you and your crew can sail your sailboat, and not necessarily the VMG of your sailboat, unless the helmsman and sail trimmers are world class sailors who can react like America's Cup sailors. Polar diagrams are the theoretical benchmarks or goals based on algorithms used in the VPP in which you and your crew shoot for while sailing to get as much speed out of your sailboat while racing. The US Sailing organization generated the first "VPP", which was written at MIT. As stated in a previous post you can buy the results of the VPP computer program from US Sailing, which will be the polar diagram for your sailboat. I don't think that the VPP has the algorithm for a "Water Ballast" sailboat such as the Hunter 240 or 260. The US Sailing organization also has a "Pay-As-You-Play" web site that has a "Watered Down" VPP that will generate a polar diagram based on a very limited amount of input parameters. You have to submit a credit card and I think it costs you $5 to run the calculation and get a result. I haven't tried it, so I don't know whether it's worth it. You can also surf the web for companies with VPPs that will generate a polar diagram for your sailboat or you can buy a VPP software package. The cheapest VPP sells for $50. Unless you are a diehard racer trying to squeeze a tenth of a knot out of your boat, a polar diagram isn't worth it. If you can't make target speed or VMG, then its either the crew can't trim as fast or the helmsman is slow to respond or the bottom is foul or the sails are old or the VPP algorithm doesn't match the physical parameters of your sailboat. If you exceed target speed or VMG, then its either you should be a captain for the America's Cup or your instruments are out of calibration or the VPP algorithm is poor. Fair Winds, Clyde
Attachments

- This site uses cookies to help personalise content, tailor your experience and to keep you logged in if you register. By continuing to use this site, you are consenting to our use of cookies. Accept Learn more…
IMAGES
VIDEO
COMMENTS
A polar diagram, or polar plot, is a graph that shows a sailboat 's potential speed over a range of wind speeds and relative wind angles. [1] It normally consists of the right side of a line chart with the radius representing the yacht speed and the angle representing the wind direction blowing from top to bottom.
Download polar files If you don't want to create your own polar file, download all polar files here >> . For download: Right click on the file "Save file as".
A polar diagram describes how fast a sailing boat may go at different wind speeds (TWS) and in different angles to the wind (TWA). Every type of boat has its polar diagram (or VPP, velocity prediction program), computed from hull shape, weight, rigging and a sail setup. Seapilot uses the polar diagram to compute the fastest choice of path at a ...
The polar plot is the navigator's friend. It's essentially a graph that shows how fast your boat can go in a range of wind speeds and angles. Polar plots are published by each manufacturer for each model of boat with their various sail plans. Below is an example of one particular boat for three true wind speeds; 16 knots, 12 knots, and 8 knots.
Polar diagrams for sailyachts with ORC certificates. Select one of the boats below, search by ... All data is fetched from ORC.org. Random boat. Greatest maximum speed (kts) POL20180 I LOVE POLAND 24.52; USA/CAY007 Vesper 19.67; GER7111 VARUNA 19.44; GER/BOD49 WILD LADY 19.09; USA45 BELLA MENTE 18.46; ITA18215 ANYWAVE 17.96; GER7323 ...
A polar diagram shows how fast a sailboat could potentially travel at different wind speeds (TWS=True Wind Speed) and various angles to the wind (TWA=True Wind Angle). Every sailboat model has a unique polar diagram, which displays the results obtained using a velocity prediction program (VPP) based on the craft's weight, hull shape, rigging ...
Polars, also known as a polar diagrams, describe how fast a sailing boat may go at different wind speeds (TWS) and at different angles to the wind (TWA). Every type of yacht has its polar diagram (or VPP, velocity prediction program), computed from hull shape, weight, rigging, and sail setup. Axiom uses this polar diagram information to ...
A properly trimmed sailboat will track this C curve. You can read the Polar Plot by placing the boat on the C curve and tracing around the concentric arc to determine the speed of the boat. For example, click on 60, this will point the boat so that it is sailing at 60 degrees off from the wind direction.
5 tips on developing your polar diagrams to improve your boat speed. To help minimise your losses you need to sail your boat to its target boat speeds. Jonty Sherwill asked designer Mark Mills for ...
The following is a typical polar plot diagram of a typical monohull sailboat. The colored circular lines represent the boat's speed at any given constant wind speed. ... BUT, until the boat reaches its polar speed, immediately after a wind speed change, you WILL experience a temporary lift if the true wind speed increases or a temporary knock ...
Click on any TWA (true wind angle) on the right bar and watch: a. the boat icon move to that position on the polar plot. Then read around the polar plot to find the boat speed. b. the wind meter boat speed and TWA. They should match the polar plot if the sail trimmers are doing their job properly. On a real polar plot, you would see other true ...
The ORC Speed Guide uses the ORC VPP to develop polar diagrams for your yacht. These diagrams are an asset to understanding relationships between performance, sail selection, wind speed, and wind angle. They display the polar data in graphic, tabular, and digital formats, including the format used by the Expedition routing program.
Introduction to Polar Diagrams and Optimum VMC. A polar diagram is a graphic presentation of a sailboat's sailing performance in various wind conditions. The same information is also often presented in the form of a table or spreadsheet, which is how the data are originally collected or computed, which in turn is then plotted on a polar diagram ...
A polar diagram is a graphic presentation of a sailboat's sailing performance in various wind conditions. But how do you interpret it? The same information is also often presented in the form of a table or spreadsheet, which is how the data are originally collected or computed, which in turn is then plotted on a polar diagram as shown below.
Pro navigator Stan Honey explains how using your boat's polars offshore can get you down the track faster. "From the Experts" in our June 2008 issue. In the April '08 issue we covered how to use ...
Polars & Performance. Below is a collection of polar diagram from various sources. Mostly in numerical format to easily plug into routing software. They're published here just to play around with. For serious/real use you should get a real one for your specific boat. Also some links to tuning guides and other perfomance related info.
A Polar Diagram shows your boat's performance at a given wind speed and angle. Polars tell you that if the wind speed is X, and you are sailing at an angle Y towards the wind, then your theoretical maximum boat speed is Z. These diagrams are typically made by your boat manufacturer, or by rating organizations such as the Offshore Racing ...
The term Polar Diagram, or Polar is often used to refer to the performance data itself. Sailboat Polar diagrams. Here is an example of a polar diagram, as presented in LuckGrib: There are a few points to know when reading this diagram: the top of this diagram, labelled 0°, is the bow of the boat. the bottom, labelled 180°, is the stern. this ...
Polar diagrams help you predict how fast you'll sail for a given wind angle and wind speed. These diagrams are fantastic tools to help you understand how well you are sailing compared to your optimal performance - and with advanced sail systems like Orca, they make preparation ahead of a sailing trip or a race a lot easier.
The LG polar catalog lists about 100 different vessels. Motoring polar. LG also offers a "Motoring Polar" menu. For those not familiar with the concept of a motoring polar, every boat operates differently under power. Also, when hopping across the bay, you may run at 2300 RPM, but on a crossing you would run at 1800 RPM to save fuel.
This polar diagram was applied in many sailboat papers to determine sailboat potential or for use as a lookup table for speed control (Briere, 2008; Plumet et al., 2015; ...
Beneteau First 36.7 & 260 Minneapolis MN & Bayfield WI. Mar 26, 2018. #1. It's out of beta now. An on-line VPP system Avalon Navigation (a French Company) will do a very decent job of creating polars for your boat, IF you can provide the detailed measurements required for hull, crew, and sails. Hull is by far the most critical and hardest.
For example, base on a hypothetical polar diagram a sailboat sailing with a wind speed of 10 knots; the best angle to sail upwind is 40 degrees which will give you a VMG or target speed of 6 knots. If that same sailboat fell off to an angle of 35 degrees the boat speed would be 5.6 knots. The Polar diagram determines the optimum sailing VMG or ...